
Alaska is home to the largest number of mountain glaciers on our planet. The estimate proposed by Bruce Molnia of the USGS is 75,000 km2 of ice-covered area, roughly 35 times that of glaciers in the Alps and representing 5 percent of the entire area of the U.S. state. Compared to the Alpine context, there is a very considerable variability in morphological and dynamic features. While most mountain glaciers lose mass through melting of surface ice, many glaciers in Alaska have foreheads that flow into the sea (tidewater glaciers), thus losing mass almost only through iceberg calving. This process, which goes by the name of calving, seemingly simple, has a remarkable complexity and, according to numerous researchers (eg., Post et Al., 2011) causes a “disconnect” between glacial and climatic variations.
Casting glaciers are affected by numerous dynamic and morphological factors that lead them to have cycles of slow and steady advances that can last even centuries, alternating with rapid retreats that can lead, as in the Glacier Bay region, to the total collapse of an entire huge ice sheet within two centuries. Changes in these glaciers therefore require very careful assessments before they can be linked to climate change, and their influence on triggering these cycles of advance and retreat is still a frontier of research. Despite these difficulties of interpretation, in recent years most of Alaska’s glaciers have lost volume to the extent that a very recent study published in Science remarked on their importance being currently among the largest contributors to ocean level rise.
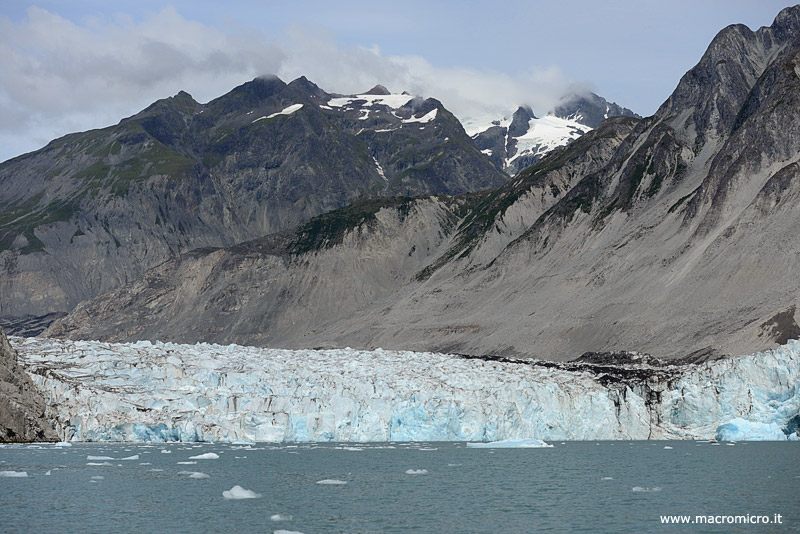
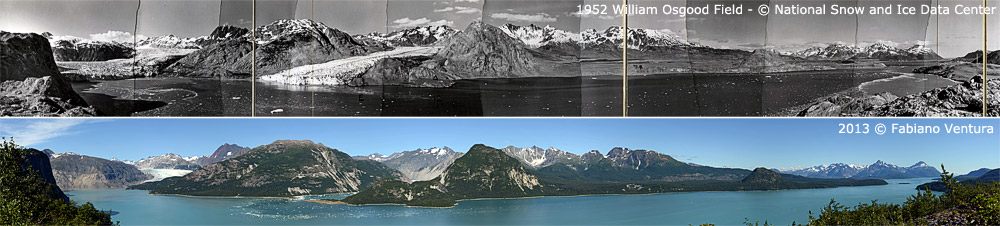
The Glacier Bay region is located in Southeast Alaska and is marked by a remarkable snowiness guaranteed primarily by the Faiweather Range, an imposing mountain range that rises directly from the Ocean causing one of the most important natural damming of wet currents in the world. In 1770 Glacier Bay did not exist; a huge ice cap more than 6,000 km2 wide and more than 1.5 km thick filled it completely. By 1784 the glacier had receded 8 km, beginning to “uncover” what would later become Glacier Bay proper. The most impressive glacial collapse of the entire planet in historical times occurred next, in 1879 John Muir had to sail 60 km into the bay to reach the glacier front that would later take his name. The retreat continues into the 20th century for as many km and leads to a complete breakup of the great ice sheet into many glaciers that cut into almost every small fjord in the bay. Each of these begins to show its own dynamics, with some beginning to advance again, e.g., the Johns Hopkins, some advancing violently several times and then beginning to retreat again (eg. Rendu Glacier); many others continue to retreat, bringing their fronts out to sea and thus beginning to behave like “normal” mountain glaciers.
According to Prof. Motyka and his colleagues, the impressive breakup of the Glacier Bay ice sheet from the Little Ice Age to the present has resulted in a volume loss of 3450 km3, which is equivalent to a rise in the oceans of the entire planet of 1 cm. In recent years several researchers, including J. Arendt have studied recent elevation profiles of the major Glacier Bay glaciers confirming a generalized mass loss, rather in line with the retreat of other Alaskan glaciers. The question posed by Arendt himself is emblematic: “From an interpretive point of view, the thing that is perhaps most important about the history of tremendous glacial retreat in Glacier Bay is to discover the cause of the retreat itself.” Recent discoveries about the cycles of tidewater glaciers help to understand how such a rapid and violent retreat was possible, which is also why the story of Glacier Bay can teach much about what might happen in enormously larger glaciated areas such as Greenland and Antarctica.
Data from the main glaciers in Glacier Bay.
|
Glacier |
Front height (above and below sea level) |
Width (km) |
Length (km) |
Flow speed (meters/day) |
Activity level |
| Grand Pacific | 20–55 m above 0–20 m below | 3.2 | 55.5 | 0.3–1.2 | Slow retreat with thickness loss |
| Johns Hopkins | 75 m above 60 m below | 1.6 | 12.5 | 3–4.6 | Advancing and gaining thickness |
| Lamplugh | 45–55 m above 3–12 m below | 1.2 | 27.5 | 0.6–0.9 | From stable to slow retreat with thickness loss |
| Margerie | 75 m above 15–30 m below | 1.6 | 33.8 | 1.8–2.4 | Stable |
| McBride | 60–75 m above 90 m below | 0.8 | 19.3 | 4.6–6.1 | Rapid retreat |
| Muir | 10 m above | 0.5 | 20.1 | 0.2 | Slow retreat with thickness loss |
| Reid | > 5–40 above 0–3 m below | 1.2 | 15.3 | 0.3–0.9 | Slow retreat with thickness loss |
| Riggs | 5–30 above | 1.2 | 23.3 | 0.3–0.6 | Slow retreat with thickness loss |
Data by Dr. Dan Larson of CRREL
Bibliography:
Arendt A, Larsen C, Loso m, Murphy N, Rich J (2012) Alaskan National Park glaciers – status and trends: First progress report. Natural Resource Data Series NPS/AKR/NRDS—2012/403. National Park Service, Fort Collins, Colorado.
Molnia BF (2008) Glacier of Alaska. US Geological Survey Professional Paper 1386-K, Washington DC, 525 pp.
Motyka RJ, Larsen CF, Freymueller JT, Echelmeyer KA (2007), Post Little Ice Age glacial rebound in Glacier Bay National Park and surrounding areas, Alaska Park Sci. J., 6(1), 36–41.
Muir J (1915) Travels in Alaska. Houghton Mifflin, 288 pp
Post A, O’Neel S, Motyka RJ, Streveler G, (2011) A Complex Relationship Between Calving Glaciers and Climate. Eos, Vol. 92, No. 37, 13 September 2011, 305-311 pp.


